Infographics

The Marketing Funnel – Should You or Shouldn’t You?


I was recently asked whether I organize my marketing thinking along a demand or marketing funnel.  This question brought to mind a set of two blog posts (“Advertising Week 2011 Key Themes” and “And, uh the a ha is“) from October 2011 covering Advertising Week.  I have included the relevant sections below.  While I am still refining my answer to this question, this is my initial response:

  1. On many occasions, I do organize my thinking along a demand or marketing funnel. It depends upon the specific marketing initiative or challenge.  I find the marketing funnel useful when addressing macro issues such as the role of “upper funnel” awareness communication vs. “lower funnel” direct response activities – and how these should be coordinated or integrated.  It is also a valuable framework for ensuring that a brand reaches its target customers at each stage of the path to purchase with the right message at the right time and using the right medium or platform.
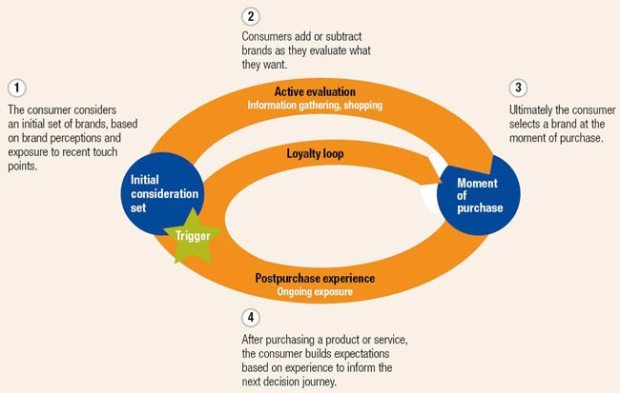
  2. The metaphor of a funnel in which the number of prospects or size of the consideration set becomes more focused in each phase is less relevant in today’s non-linear, iterative digital and social environment. Today’s framework is more of a decision journey loop with a consideration set that may contract and/or expand along the way and in which post-purchase communication and activities such as social sharing and an ongoing dialog are crucial.
  3. I often use a customer journey map or customer-specific path to purchase that incorporates the way in which consumers move from one platform to another as they interact with a brand. This approach frequently includes the development of customer personas and/or the identification of moments of truth.  It has its origins in the marketing funnel and is an expansion of it.

And, Uh, the A Ha Is: 

The ruling on the purchase funnel is not final.  Most agree publicly that the traditional funnel, e.g., awareness, consideration, intent, purchase, loyalty – or as I was taught in business school, AIDA: Awareness, Interest, Desire, Acquisition, needs to be updated.  The patch to purchase is no longer a straight line.  The funnel of choice seems to be the McKinsey oval, which you can view in my summary of the panel.   (No mention of the Forrester “path to purchase” in the age of social engagement – see below).

The key takeaways are that:

(a) the process is iterative and circular

(b) must include advocacy

(c) many include “loyalty,” but that’s not new, that’s just “adoption.”

However, when we got to the TV panels, the upward and lower funnel nomenclature was still front & center.  A disconnect?

Figure I: Forrester Path to Purchase in the Age of Social Engagement

Customer Journey in the age of social media – Forrester

Figure II: Harvard Business Review – Traditional Funnel and McKinsey Consumer Decision Journey

Advertising Week 2011 Key Themes:

The Funnel (aka Path to Purchase and Consumer Decision Journey) – The traditional funnel is outdated.  However, much of the terminology has survived and/or been incorporated to the new, bright shiny (Mustard colored) circular tubes.   There is some consensus about the fact that the process is no longer linear but more of a circular conversation. – However, the term “funnel” as well as “top” and “bottom” of funnel and stages such as awareness, consideration, acquisition were used frequently, particularly by CMOs.  However… the funnel must include advocacy.  (Social, social, social)  And, the funnel is iterative and, well, free flow.
Mobile Facts Change So Fast! – a repository for key mobile stats and facts (2011+)


On at least three occasions, I have written posts that incorporated a summary of notable stats about mobile apps and the mobile space in general to set the scene for a topical discussion.  But the facts change so fast that I was continuously updating the posts, and the posts had a tendency to grow and grow at the rate of foursquare subscribers.  (See here for 2010 post) So, I’m starting afresh and focusing specifically on notable mobile facts starting with these:

A mobile marketing strategy is a must-have for retailers – and, I would venture, anyone that sells products to consumers.  In fact, with today’s predictive marketing capabilities, retailers and marketers can target purchase intenders at the time and place of potential purchase.

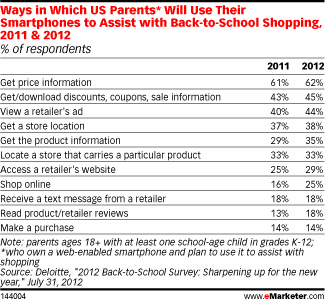
Nine out of 10 smartphone shoppers use their phone for “pre-shopping” activities like finding store locations, comparing prices and reading product reviews. Source: Google via Shop.org Think Tank. 07/24/2013

Teens and Mobile (July 2011 data, except where noted) – Pew Research:

  • As of July 2011, 77% of teens have a cell phone (Teens, Smartphones & Texting).
  • Older teens ages 14 to 17 are substantially more likely to have a cell phone than younger teens ages 12 and 13 – 87% of older teens have a cell phone, compared with 57% of younger teens.
  • 23% of teens have a smartphone; 54% have a regular cell phone (or are not sure what kind of phone they have), and another 23% of teens do not have a cell phone at all.
  • Overall, half (49%) of all American teens have gone online on their mobile phones in the last 30 days.
  • The bulk of teens are 12 or 13 when they get their first cell phone (see: Is the age at which kids get cell phones getting younger?)(September 2009).
  • See more in the Teens, Smartphones & Texting report.

Teens and Communication choices (July 2011, except where noted) – Pew Research:

Texting dominates teens’ general communication choices. Overall, 75% of all teens text, and 63% say that they use text to communicate with others every day.

  • 39% of teens make and receive voice calls on their mobile phones every day.
  • 35% of all teens socialize with others in person outside of school on a daily basis.
  • 29% of all teens exchange messages daily through social network sites.
  • 22% of teens use instant messaging daily to talk to others.
  • 19% of teens talk on landlines with people in their lives daily.
  • 6% of teens exchange email daily.

Teens and Texting (July 2011, except where noted) – Pew Research:

The volume of texting among teens has risen from a median 50 texts a day in 2009 to 60 texts for the typical teen text user.

Older girls remain the most enthusiastic texters, with a median of 100 texts a day in 2011, compared with 50 for boys the same age.

Click here for more on what teens do with their phones.

26% of American teens of driving age say they have texted while driving, and 48% of all teens ages 12 to 17 say they’ve been a passenger while a driver has texted behind the wheel (September 2009 survey; see Teens and Distracted Driving)

This is the year of the Tablet:

About 68.7 million tablets shipped worldwide in 2011, according to IDC, which forecasts 106.1 million units to ship this year (April 17, 2012)

Smart Phones have reached the tipping point:

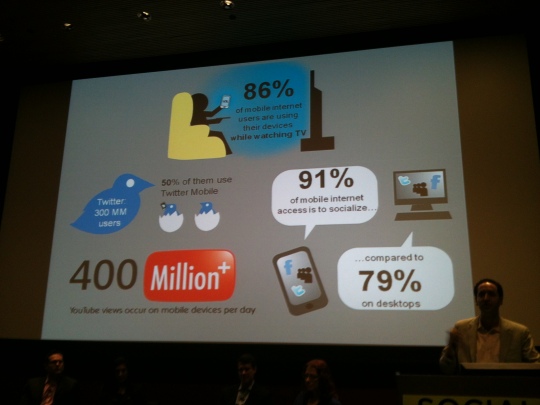
86% of mobile internet users are using their devices while watching TV.  Are people fast forwarding through your commercials or engaging with their smart phones while they’re on?  If so, has your commercial motivated them to do something related to your brand or prompted them to do something else to pass the time?

Android Apps Reach 400,000

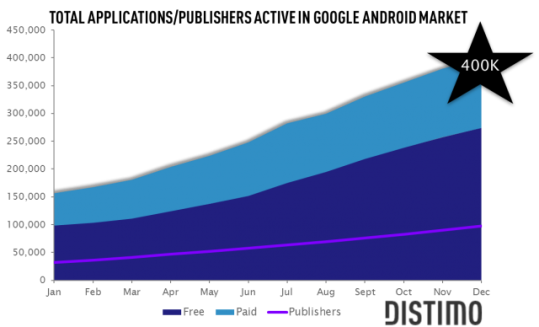
In December 2011, Google celebrated their ten billionth Android app download, and now new research from mobile app analytics firm Distimo reports that there are 400,000 apps available in the Android Market. (Scroll all the way down for a post about Android apps reaching 90,000 in July 2010!)

Free apps make up a considerable portion of that 400,000, and Distimo’s research indicates that the ratio of free to paid apps has jumped from 60% to 68% over the last eight months. Distimo pegs the prevalence of free apps on the current popularity of the freemium  app economy, which also isn’t much of a surprise considering the potential payouts inherent to the model.

Mobile Is a Hotbed of VC

Mobile marketing was the most active segment within digital advertising for mergers, acquisitions and investments in 2011, according to a new report from marketing and media investment bank Petsky Prunier.

The iPad Revolution:

Only 13% of Web Traffic Is Mobile:

While mobile devices are expected to surpass laptops and desktops for accessing the Internet, they account for only 13% of web traffic today (still not shabby).  This is due in part to the lack of mobile optimized websites, a situation that is changing.  Within the 13%, more than 80% of comes from iPhone and iPads:

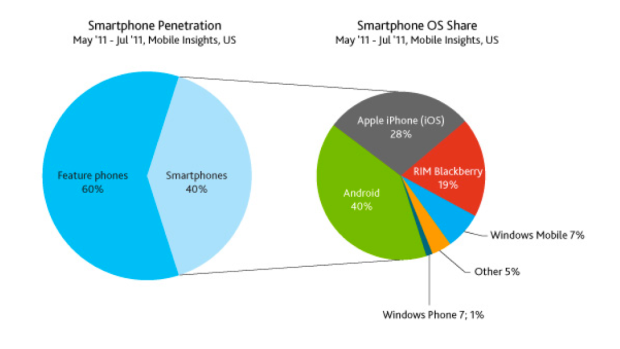
40% of Mobile Phones Are Smart Phones (Source: Nielsen)

Becoming the Primary Means for Accessing the Internet

Mobile devices and connected TVs are expected to overtake personal laptops within the next year as a means for accessing the Internet.  I hope your website is optimized for mobile and mobile search…

“I Love My MacBerry”  – Literally

  • A study using MRI scans showed evidence of not only addiction to iPhones but also Love.  (I admit it.  I’m hopelessly hooked.  I’m even willing to put up with the fact that my AT&T iPhone often hangs up on me.  Is that a sign of codependency?)

iPads, iPhones, iPods and More – How Many Were Sold in Apple’s 4Q 2011

  • The Company sold 17.07 million iPhones in the quarter, representing 21 percent unit growth over the year-ago quarter.
  • Apple sold 11.12 million iPads during the quarter, a 166 percent unit increase over the year-ago quarter. (That’s 20.37 million iPads in Apple’s fiscal 2011 2H – ALONE, which does not include what will likely be a huge holiday purchase season for the device, and annualizes to 44.5 million per year)
  • The Company sold 4.89 million Macs during the quarter, a 26 percent unit increase over the year-ago quarter.
  • Apple sold 6.62 million iPods, a 27 percent unit decline from the year-ago quarter.

iPads, iPhones, iPods and More – How Many Were Sold in Apple’s 3Q 2011

  • 9.25 million iPads were sold during Apple’s 3rd quarter, 2011, up 183 % vs. year-ago (That would annualize to 37 million per year.)
  • 20.34 million iPhones were sold, up 142 percent vs. year ago (That’s a pretty nice stat – and impressive given growth of the Android.  A testament to the dramatic growth of smartphone in general)
  • (That means that nearly 30 million iPads and iPhones were sold this quarter.)
  • 3.95 million Macs, up 14 percent vs. year-ago (iPads cannibalizing Macs.  I would say, “yup.”  Especially laptops – by all manufacturers – and, perhaps MacBook Airs.  I think the Christmas season is going to blow the current iPad number out of the water)
  • 7.54 million iPods, a 20 percent unit decline from year-ago.  (I saw a young man on the subway today using the iPhone as an iPod with headphones – ironic as he had to hold the relatively large device.)
Observations,  Implications and Hypotheses:
  • Nearly 30 million iPhones and iPads were sold.  Compare that to less than 4 million Macs (laptops and desktops, up only 14 percent vs. year-ago) – and less than 8 million iPods, DOWN from year ago.  iPads and iPhones seem to be cannibalizing laptop, desktop and iPod sales.
  • More than twice as many iPads sold as Macs.  iPads are definitely cannibalizing laptop sales
  • iPad sales equivalent to 1/2 iPhone sales
  • In sum, iPads are HOT.  They’re starting to reach a tipping point from: it’s cool to have one to it’s not cool not to have one (I hope that made sense, i.e., it’s becoming embarrassing to not have one – I predict I’ll give into peer pressure within the year at most)
  • Quite a large increase in iPhone sales given growth of Android penetration; hence, it seems that the overall pie is heating up

Source: Apple 3Q earnings report

Being Mobile at Home

Don’t mistake mobile device usage with being mobile… A good chunk of time spent with smart phones, PDAs, iPads, eReaders and other such devices is spent at home.  Think about it.  Picture your well-wired friend – or maybe it’s you – with a laptop before you, a smartphone in your hand, an iPad on the sofa beside you, and an Internet connected TV shimmering its HD (or 3D) images from across the room.  In fact, the latest data from ComScore shows that tablets have the highest share of traffic for digital news consumption during evenings, beating out computers (as well as smart phones) in at-home news consumption. (Source: Moxie Pulse)  Moreover, GlobalWebIndex data suggests that, globally, half of those who access the mobile web do so from home or work, rather than while traveling or “roaming,” or while in a public place.

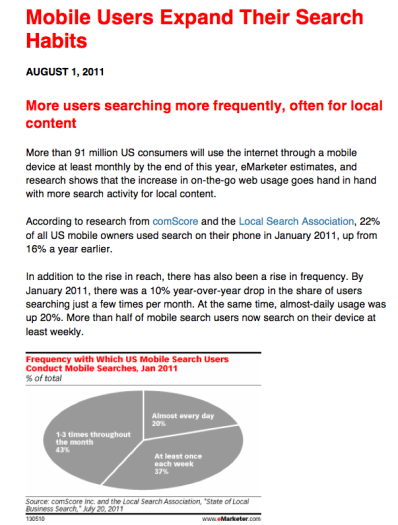
91 MM Americans Use Mobile Search

Overall, more than 91 million US consumers use the Internet through a mobile device at least monthly, and this increase in on-the-go web usage goes hand in hand with more search activity, particularly for local content.  20% of mobile search users do so almost every day.

Meanwhile, the debate between App and Wap (ok, browser) continues, with mobile search engine usage currently exceeding search via apps by 70% as of August 2011 – According to Yahoo! and Ipsos, via eMarketer.

Facts from Jimmy Wales at OMMA Global (September 26, 2011)

  • One out of every two Americans owns a smartphone [whoah, that’s DOUBLE the 25% shown for Q2 2010 if you scroll down]
  • 15.1 million tablets shipped worldwide (I have seen other numbers for this metric that I will add to this post… Ok, eMarketer is estimating 24MM for 2011 and 46MM in 2012)

Android is #1 U.S. Mobile Operating System – Q2 2011

  • As of June 2011, the Android operating system accounted for 39% of the total U.S. mobile market, making it the #1 mobile operating system in the country.
  • Apple maintains its share of 28% share, while Blackberry OS from RIM (Research in Motion)  has fallen from market leadership (nearly 40% in 2009 – scroll down) to third position with only 20% market share.
  • These three operating systems (representing 87% of the market) are followed by Windows Mobile/WP7 (9%), Palm/HP Web OS (2%), and Nokia’s Symbian OS (2%)
  • Apple is the leading handset maker in the United States whilst Android is the top mobile operating system. (Nielsen)
  • Apple overtook Nokia to become the world’s leading smartphone vendor in July (Nielsen research and IDC figures)
  • According to a report by the NPD Group, the Android operating system accounted for 52% of the smartphones sold in the second quarter of 2011, up from 36 percent sold in Q1 2011 according to previous data by Gartner.


Social Media Tidbits II


Visit me here – or on Pinterest – for social media tidbits I find share-worthy.  Share with me your thoughts and infographics you fancy.

Women dominate Facebook, Twitter, Pinterest and Zynga.  Men dominate Reddit, Google+ and LinkedIn.  Net, net, women are heavier users of social media.

So fantastic!  But… don’t blink, or this LUMAscape will be out of date.  Pinterest? (posted July 2012)

67% of consumers uncomfortable with Facebook’s use of data (July 2012)

Tweet, Tweet, Tweet – 100 million strong — 21 million active in U.S.

Social Media and Recruiting:

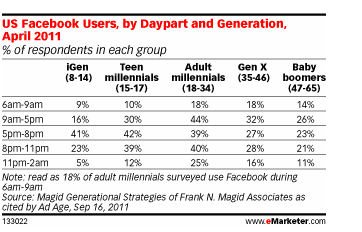
Using Facebook during the workday?  Sure!

Which Social Media Activity Do Companies Feel Benefit Them the Most?

I suspect this varies by company, e.g., a customer service/complaint/service oriented company such as Time Warner Cable, Comcast, Bank of America, etc., might rank customer support higher.  As Ted Schadler wrote in “Empowered,” customer service has become a form of marketing.  Think Zappos and Virgin America.

Always On: 2011 in review


The WordPress.com stats helper monkeys prepared a 2011 annual report for this blog.

Here’s an excerpt:

A New York City subway train holds 1,200 people. This blog was viewed about 6,800 times in 2011. If it were a NYC subway train, it would take about 6 trips to carry that many people.

Click here to see the complete report.


As of April, I am now trending more than 1,100 views per month.  Thank you, everyone for visiting and reading.  You are my FAVORITE kind of person!


Playing with Pinterest, Tallying with Twitter


I finally spent an evening (ok late night) playing with Pinterest, and I can see why it’s so addictive. So many beautiful images. It’s visual decadence and indulgence.

It’s uplifting. A great way to spend half an hour… or more. It’s also extremely easy to use with an overall positive vibe (or tone, as Pinterest would say). People are sharing things they find uplifting or attractive or thought provoking, in a light hearted way. As of now, no disturbing images. And wonderful production quality. I wonder how they control for that. Images come from the Internet, so they’re not really user generated – though they are user curated. That maintains this highly polished experience.

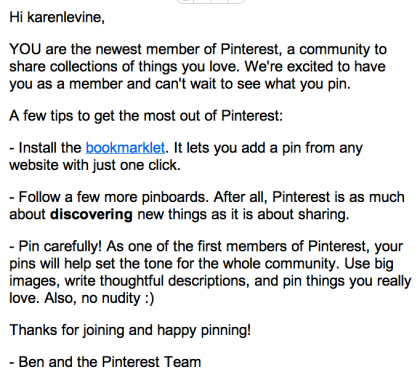
But what’s especially nice – it’s all about the details – is the email you get when you sign up: “Hi karenlevine,” it says, “YOU are the newest member of Pinterest, a community to share collections of things you love. We’re excited to have you as a member and can’t wait to see what you pin.” Now that’s just nice.

Twitter, of course, is also addictive, but in a different way. On Twitter, I find myself almost unhealthily aware of how many followers I have. Am I loved??? Am I respected?  It’s like they days when you would come home and rush to see whether you had voicemails.

Every time I post something on Twitter, I watch to see if it leads to more followers – in that vast community of hundreds of millions of people I don’t know. Someone out there shares a topic I am interested in and felt that what I had to say merited following me.

Of course, I also look to see whether I have been retweeted, the ultimate compliment. Or retweeted my multiple people, a real head rush.  And then there are the responses. The exchanges you have with someone you don’t know at all. At social media week, it was truly fun to watch people who had somehow ended up following or corresponding with each other meet in person. And because the avatars are typically photos, it makes it that much easier.

Pinterest: The Newest Face of Social Media


This is the newest face of social media.  It’s the site that no one knew much about a few months ago and everyone is talking about at Social Media Week today (February 2012).  Pinterest is a virtual pinboard that lets you organize and share all the beautiful things you find in your life.

(It’s a good thing they started with the word pin board rather than cork board or bulletin board… When I was a teenager, I badly wanted my parents to turn one of the walls of my bedroom into a bulletin board!  When I got to college, I learned about the magical powers of tape.)

The key element of pinterest is the focus on images.  Like Instagram, it showcases one of the most important aspects of social media today – sharing photos and other images.  It seems to me that Facebook has become not only Flickr but those emails you used to get with humorous graphics.  It makes the site a fun place to stop off before bed.


Social Media Tidbits I


Visit me here for social media tidbits I find worthy of sharing.  Share with me your thoughts.

Do You “Like” Me?  Do You Really “Like” Me?

Much of both Advertising Week and OMMA Global was spent talking about the importance of being “Liked,” as in the Facebook “Like” functionality.  The conclusion was that (a) consumers don’t hate advertising, they hate bad advertising… (b) if you keep it under control, it can be powerful (c) consumers DO want to have relationships with brands they care about – as well as those who offer them something for being their “friend.”  So, ironically, today’s eMarketer article includes two charts about consumers attitudes towards letting brands/advertisers/companies into their Facebook worlds:

Discretion

We’ll move now to a personal admonition – things individuals should consider before posting on their social networking site (69% of prospective employers have rejected a candidate based on something posted on a social networking site).  Below, we get into what organizations should do at a minimum in social media – to avoid regrets.

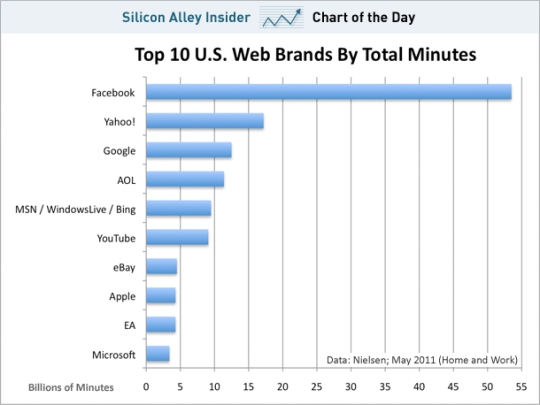
The chart below shows the huge draw Facebook has on our time.  Far and away higher than any other U.S. Web Brands in terms of total minutes.  I was intrigued by the Facebook phenomenon back when I joined in early 2006  (as one of 7.5 MM unique users) – and suggested my media client take a serious look at it.  At the time, Facebook was just opening up beyond college students.  Here are some bullet points I put in my report in February 2006:

Overview:

  • Social network site for college & university students
  • Founded by Mark Zuckerberg; raised $500,000 from Peter Thiel in angel round
  • Raised $12.2MM from Accel partners in April 2005 (valuation of $100MM)
  • Began allowing high school students to join September 2, 2005: High school and college networks are kept separate.  There are 20K U.S. high schools.
Membership (info as of September 2005)
  • Must have .edu email address to join
  • Supports 1,120 colleges – 56% (Source: Scott Osman, 2/10/06 – up from 880)
  • 85% of students in supported colleges have a profile
  • 7.5MM unique users in January
  • 60% of members log in daily; 85% at least weekly; 93% at least monthly
  • Recent alums are maintaining same log in rates
  • Users can add favorite music, books, movies, quotes, etc. and see others who share same interests; can also form and/or join groups
  • Additional functionality: events, messages
Who knew!

Here’s an interesting post from ClickZ by Heidi Cohen:

What’s Your Social Media Marketing IQ?

As you make your 2012 marketing plans, consider what you need to do to take your social media marketing to the next level. To ensure your firm’s maximizing its social media effectiveness, now’s the time to check your organization’s social media marketing IQ.

Here are 30 questions to help determine your firm’s social media marketing IQ. These questions will help you assess where your organization is in terms of social media marketing maturity and where you may need to improve effectiveness. Depending on where your organization is along the social media adoptioncurve, some of these questions can help you develop plans going forward.

Listening

  1. Do you have brand monitoring and/or other analytics in place? If you don’t have the budget for professional social media monitoring, use free options such as Google Alerts, Twitter Search, and Google Analytics.
  2. Are you analyzing the information collected?
  3. Are you taking action where appropriate based on your brand monitoring? Remember, about 2 percent of the comments require any company interaction.

Social Media Guidelines

  1. Do you have social media guidelines for how employees should represent themselves and what they can say?
  2. Do you have guidelines for what’s acceptable for customers and the public to contribute on your organization’s website, blog, and/or forum? This doesn’t mean you can delete negative comments! Customers will say whatever they want on their own and third-party social media networks where you have no control.
  3. Do you have a crisis management plan? If so, do you review it regularly to ensure it’s up to date and employees know what to do? If not, here’s help to develop one.

Goals

  1. Do you have goals for your social media marketing? This is a critical first step of any marketing strategy. Don’t think it’s just a test and we’ll figure it out later. If it works, you’ll need to make a case for more resources.
  2. Are your social media marketing goals related to your overall business objectives? This is a must for any marketing plans!
  3. Is your social media marketing driving revenues? For many businesses, this is a sign of social media maturity.

Management

  1. Does senior management buy into social media as part of your marketing and business plans? Recognize this can be difficult to achieve. Research shows leadership at one in three businesses supports social media marketing after three years.
  2. If management doesn’t buy into social media marketing, are you bringing them up to speed? Chances are that you need to show how it drives results associated with business goals.
  3. Are you expanding buy-in beyond senior management? Think customer service, sales, product management, human resources, investor relations, and other organizational departments.

Social Media Marketing Strategies

  1. Do you have a social media marketing strategy? What do you want to accomplish?
  2. Are your social media marketing strategies integrated with your overall marketing plans?
  3. Are employees monitoring social media marketing implementation(s)? Customers will use every point of contact to reach a human being.
  4. Are you promoting your social media marketing efforts? To drive customers and the public to your social media marketing, you must continually promote it. Use internal media.
  5. Do you make it easy for social media participants to share your content? Think social sharing including Facebook, Google+, LinkedIn, and Twitter.
  6. Do you have tailored call-to-action and tracking mechanisms integrated into your social media marketing efforts?Prospects and customers need to be guided through your sales process.

Social Media Marketing Content

  1. Are you creating tailored content for your social media marketing initiatives? Since social media thrives on content, ensure your social media efforts have the fuel they need.
  2. Have you created a variety of content formats?
  3. Does your content support every stage of the purchase process? The information consumers need may cut across your organization. To support these efforts, use an editorial calendar and marketing personas.
  4. Is your social media-related content integrated into your search optimization efforts?

Social Media Marketing Budget

  1. Do you have a dedicated social media marketing budget? Social media marketing isn’t free! You can’t count on having a robust social media marketing strategy without financial and headcount resources. If you don’t have a dedicated budget, can you leverage other resources or hide your social media marketing budget?
  2. Do you have headcount dedicated to your social media marketing efforts? If not, are social media marketing activities incorporated into specific employees’ job descriptions? If no one’s required to do the work, it won’t happen.
  3. Do you have social media training to ensure employees understand how to engage on social media platforms and are consistent in how they represent your organization? Many firms overlook this important factor.
  4. Do you have a social media contingency plan to ensure you have personnel involved and monitoring social media 24/7?What happens if your social media manager’s sick or unavailable and there’s a problem?

Metrics

  1. Do you have established metrics to track social media marketing efforts back to marketing and/or business objectives?This is best done when you’re planning your strategy.
  2. Do your metrics include the full purchase process not just the last marketing touched? Social media can influence customers before you realize they’re shopping and after they’ve bought your product or service.
  3. Do your social media metrics go beyond marketing? Think broadly across your business such as customer service.
  4. Are you measuring the ROI of your social media marketing? Understand it takes time to have a well-integrated social media marketing strategy where you can measure your investment and results accurately. Short-term, determine whether your social media marketing contributes to achieving your business goals.

Social media marketing is a growing part of every marketer’s plans and budget. Regardless of where you are on the social media marketing continuum, you must assess the effectiveness of what you’re currently doing and implement strategies to enhance your results.

Mobile Facts Change So Fast – 2010


On at least three occasions, I have written posts that incorporated a summary of notable stats about mobile apps and the mobile space in general to set the scene for a topical discussion.  But the facts change so fast that I was continuously updating the posts, and the posts had a tendency to grow and grow at the rate of foursquare subscribers.  So, I’m breaking 2010 into its own post.  It’s not meant to relegate it to the past because it’s not only fascinating but important to see from whence we’ve come.  So feel free to compare these stats and info graphics to those in the 2011-2012 post.

Smartphone Penetration and Share Q3 2010

  • Twenty-eight percent of US mobile subscribers have smartphones as of Q3 2010, according to data from The Nielsen Company
  • 41% of recent mobile phone acquirers have smartphones
  • Among US smartphone owners, the Apple iPhone OS has practically caught up to the market-leading RIM Blackberry OS, with 28% and 30% marketshare
  • Google’s Android OS is now at 19% and growing.
  • The Android is less than 2 1/2 years old – AndroLib.com

Smartphone Penetration and Share 1st Part of 2010

  • Droid outsold Apple: In the first half of 2010, Google-powered Android phones outsold Apple’s iPhone in the U.S. (Nielsen)
  • Among consumers who purchased a smartphone in the first half of 2010, 27% opted for Android phones, compared with 23% who bought an iPhone. Android’s total market share of 13% still lags well behind both Apple (28%) and Research in Motion, maker of the BlackBerry (35%).
  • Look at Droid go!  Look at Droid grow!

App vs. WAP

  • The discussion of Apps vs. WAPs is heating up with the growth of the Android market and the number of Android champions – Motorola, Sony Ericsson, Google, etc.  The advantage of the mobile app is that it can tap into other mobile apps – and, for me, it’s just cleaner and faster to get to.  The advantage of the WAP (wireless application protocol) is that it can be richer and closer to the online experience.
  • Apple has revolutionized the mobile space by spurring the development of 200,000+ mobile apps for Apple platforms.  Google is calling the browser the “killer app” for mobile that will eradicate the need for developers to create different apps for each platform: Apple, Android, etc.  Personally, I don’t see the app marketplace going away any time soon.  The use of browser applications may increase as connectivity speed increases (says the poor woman with the AT&T service plan), but I would advise my clients to cover their bases with iPhone, iPad, Droid, and WAP versions – at the least.

Apple’s Spring Season (quarter ending June 26th, 2010)

  • Apple sold nearly 12 million iphones and ipads in the quarter ending June, 2010
  • 3.5 million Macs and 8.4 million iPhones were sold, with  iPhone sales increasing 61% versus year ago.
  • The Company began selling iPads during the quarter, with total sales of 3.3 million.
  • iPod sales declined 8% versus year ago, tapping out at 9.4 million units

Apple’s Summer Season (quarter ending September 25th, 2010)

Apple sold:

  • 3.89 million Macs (+ 27 % vs. YAGO)
  • 14.1 million iPhones (+ 91 %)
  • 9.05 million iPods (-11%) – looks like iPhones are cannibalizing iPods
  • 4.19 million iPads (that means 7.49 million since introduction last quarter)

RIM sold 12.1 million units in their last reported quarter – as a point of comparison

Apple achieved its highest revenue ever this quarter ($20.3 billion)

Apple Apps

  • As of September 1, 2010, there are at least 250,000 third-party applications officially available on the App Store, with over 6.5 billion total downloads (“Apple Special Event” via wikipedia)
  • As of June 22, 2010, there were more than 11,000 new applications created exclusively for the iPad (Apple)
  • This does not include “unauthorized” iPhone apps
  • There is a category of apps developed to help people discover… apps.  Notable examples include: AppMiner, BargainBin and StoreExtend for finding bargains and seeing what’s new; Apple’s own iPhone Apps Recommendations and Genius offerings; and Appsfire, Appsaurus, Appolicious, Apptizr and Chomp for recommendations and reviews.
  • iPhone customers who go to the App Store download almost twice as many programs as those who use Google Inc.’s Android Market or BlackBerry’s App World, according to a study from Nielsen Co. (via Bloomberg, September 13, 2010)

How Wired Are We – U.S.?

  • There were 291 million U.S. wireless subscribers as of June 2010
  • 93% of Americans have a mobile phone
  • The number of consumers accessing the mobile Internet in the United States has jumped from 54 million in May 2009 to 72 million in May 2010, a year-over-year increase of 33 percent (Nielsen)
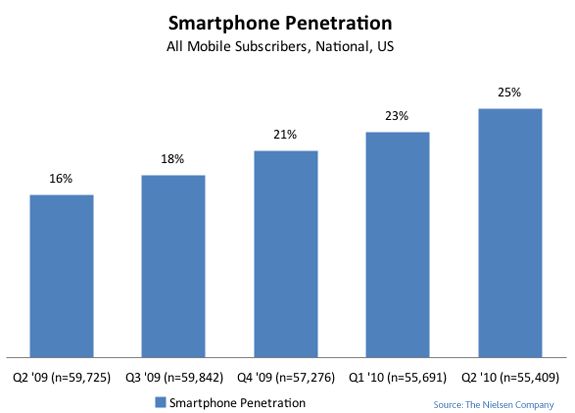
  • Multipurpose smartphones that allow users to access the web and email as well as run thousands of apps and share text and picture messages reached 25% of the U.S. mobile market in June 2010, up from 23% in the prior quarter and 16% just one year ago (data from The Nielsen Company published on its blog Nielsenwire). By the end of 2011, Nielsen predicts smartphones to overtake feature phones in the U.S. market.

How Wired Are We – Globally?

  • There are approximately 5 billion mobile phones in the world; that’s more than two mobile phones for every three people on the planet.  (4.6 billion at the end of 2009; 4.7 billion according to U.N. in February; expected to reach 5 billion in 2010)
  • There are currently 636 million mobile subscribers in India, representing 65% of the population.  The subscription base is expected to reach full penetration by 2014, creating a market of 1.2 billion mobile subscribers. (Telecom Regulatory Authority of India – TRIA, Gartner, Informa Telecoms and Media – July and May 2010)

Ad Networks for Sale

  • In November 2009, Google purchased AdMob for $750 million
  • In January of 2010, Apple acquired Quattro Wireless for $275 million
  • After stating that Google and Apple overpaid for their acquisitions, RIM opted not to purchase Millenial Media for the ad network’s $400-500 MM asking price

The All Elusive Mobile Metrics and Analytics

  • Nokia acquired Motally, an analytics firm that provides companies with data that helps them profile their customers – August 20th, 2010

Mobile Advertising

  • US mobile ad spending is expected to increase nearly 80% in 2010 to reach $743 million. eMarketer estimates that mobile ad spend will exceed $1 billion in 2011 ($1.1 billion) (eMarketer, October 2010)
  • Brand recall rates from mobile marketing are 20 times greater than for the web and 10 times greater than for direct mail (HipCricket via Mobile 4 Franchises – October 26, 2010)

Mobile Health

  • 70% med students own iPhone/iTouch, + 39% vs. 2009. 24% plan to switch to Android –ePocrates, summer 2010
  • Stanford School of Medicine has given an iPad to every incoming student in the Class of 2014.
  • According to an interview with Manhattan Research’s Monique Levy posted on the blog sitePixels and Pills, nearly 75% of physicians have smart phones – 3 times the general population.
  • According to Manhattan Research, as reported on darkdaily.com, smartphone penetration among physicians is expected to reach to 82% by 2011, with more than half that number using the devices for such tasks as administrative work, continuing medical education, and patient care.
  • 20% of physicians plan to get an iPad within the first year of its introduction – Epocrates, February 2010
  • 20 million U.S. adults are accessing health information from cell phones, smart phones or PDAs – a number that has doubled in the last year (March 2010, mmm)

Android Apps

That actually took me quite by surprise.  I had heard and believed estimates that there would be 150,000 Android apps by the end of 2010 back, I believe, in late 2009 or at the start of the year.  But during Internet Week, I was hearing numbers closer to 40,000 (apps available at that time) and over a recent dinner with Sony Ericsson execs, the number I was hearing was 60,000.

But Sebastien Chalmeton tweeted this morning that Android had surpassed the 100K mark – on about the same day that foursquare passed the 2 million mark, by the way, so I am hereby sharing that up to date mobile stat.

However… on July 14th, I attended a talk by a Google mobile executive, and the number he was given by Google PR was, in fact, 65,000, which is more consistent with what I had been hearing  I will have to circle back with AndroLib to understand the discrepancy.  Quite a contrast with Apple’s App Store – single provider, single source of data.  Does Droid have that kind of walled garden approval structure?

  • A year ago, there were 10,000 Android apps – AndroLib.com, July 10, 2010

And, uh, the aha is…


@adscientist posed the following question to me about Advertising Week’s overflowing goody bag of panels and presentations: “Did you learn a lot last week or did you look at it as a lot of obvious statements? I was looking for more insight than i got.”

His comment made me stop to think whether I could identify 5-10 true  “a has” from the conference. Here they are:


1. The ruling on the purchase funnel is not final.  Most agree publicly that the traditional funnel, e.g., awareness, consideration, intent, purchase, loyalty – or as I was taught in business school, AIDA: Awareness, Interest, Desire, Acquisition, needs to be updated.  The patch to purchase is no longer a straight line.  The funnel of choice seems to be the McKinsey oval, which you can view in my summary of the panel.   (No mention of the Forrester “path to purchase” in the age of social engagement – see below).   The key takeaways being that: (a) the process is iterative and circular (b) must include advocacy (b) many include “loyalty,” but that’s not new, that’s just “adoption.”  However, when we got to the TV panels, the upward and lower funnel nomenclature was still front & center.  A disconnect?

Figure I: Forrester Path to Purchase in the Age of Social Engagement

Figure II: Harvard Business Review – Traditional Funnel and McKinsey Consumer Decision Journey

2. I was incredibly impressed with Comcast’s Xfinity vision of how its subscribers will be able to interact with their cable TV menus and the ways in which it will connect to the digital world in terms of (a) broadcasting “likes” (b) finding out what friends “like.”  And, RADICAL, there will be KEYWORD SEARCH!  (When I asked about search functionality at an Advanced Advertising panel in 2010, I received a combination of perplexed and blank stares…) – See Graphic to the right

3. Everyone is on the Facebook bandwagon.  We’re convinced that consumers want us there, and, while I don’t necessarily disagree – after all, a truly successful brand is a “friend” to an emotionally connected consumer, I’m concerned that we may tip the scale and kill the golden goose.

It’s (a) about the balance of push and pull in terms of broadcasting info (b) the ratio of real people to brands.  If kids leave the service when there are too many adults, what will adults do when there are too many brands?

4. Brands are content creators.  This is not new – see Larry Kramer’s recent book C-Scape, Conquer the Forces Shaping Business Today and recall Coke’s Polar Bear campaign (ahead of its time, or pre cursing the future that is today?), but it was a major theme, which means that it is becoming more mainstream.

5. SEM and ad networks are getting more advanced.  Google has new multi-media listings.  aol, yahoo and microsoft are creating a three-way ad network.  Programmed trading (wait, are we talking about finance), is growing.

All for now except:

If you don’t have an iPad, you’re so not cool.  Get thee to an Apple Store pronto!  (iPads, like Facebook profiles of a few years ago, have reached a point where it’s not that you’re cool if you have one but that you’re NOT cool if you don’t have one.)

Advertising Week 2011 Key Themes


Matt Scheckner of Advertising Week begins each panel with the following comment: people always ask what is the theme of Advertising Week this year.  And his answer is that there is not a specific theme.  They identify the themes people care about the most and then find the smartest people to discuss those areas of interest.

So… what are the recurring themes that have bubbled to the top?  Below is my iterative stab at it.  Please share your suggestions, edits, corrections and comments:

1. Social, Social, Social – at least as many social talks as mobile talks.

– Social is a double edged sword.  You have less control over it than we delude ourselves into thinking.  If your product is not good, social will hurt more than it will help.

– Must use social as a listening post – and react quickly: “Fail fast.”  Own up to mistakes, e.g., Domino’s and Virgin.  Don’t take someone on who has a large social following… (Maytag)

2. Facebook, Facebook, Facebook

– “Everyone is on Facebook,” Nick Sheth, Gap Inc.

Walmart has nearly 10 million fans. Coca Cola has 34.5 million.

– The open graph, the timeline and the new ad formats (sponsored stories) that leverage the opinions of your facebook friends. (What, by the way, is Facebook doing to educate its actual mainstream users about these innovations.)

– Do consumers want to have relationships with their favorite brands on Facebook?  Answer seems to be, sure.  I think the key is the right balance between push and pull.  I’m a bit concerned that brands might become to the Facebook community as adults are to kids.  Once too many of them are on the platform, the people may leave… will we kill the golden goose?  It’s a delicate balance.

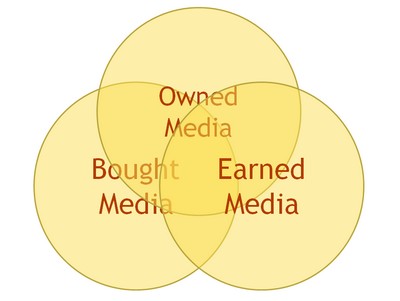
3. Paid, Earned, Owned

– Separate from this conference, Chris Lubin of Attention USA, added a fourth adjective to this marketing triumvirate: shared.  In a recent blog post, he wrote:  “As social media matures, and audiences grow within branded environments, shared media gains importance. The most efficient way to build audience in social media is to co-opt the audience of a partner or like-minded brand—share. So, smart brands are using social channels to barter exposure, and cross-promote.”

4. Content Creation

– Brand as Content – Content as Brand: Marketers have (or must) become content creators

– People don’t hate advertising, they hate bad advertising.

– That’s an opportunity for agencies

– Deep dive into what Coke has and is doing – beginning with the revolutionary Polar Bear campaign (remember that!)

5. Metrics (and Data)

– Measure it. CMOs continue to be increasingly accountable for ROI, even display ads on in-store behavior

– The census.  What is this data telling us, particularly about cultural diversity and influence.  50 million Hispanics.  (Does this include “undocumented?” I imagine it does.)

– Continued debate and discussion around attribution.

– “A like, a friend, a follower.. a click” what is that worth to a brand?

– The “Data Management Platform,” aka DMP

6. The Funnel (aka Path to Purchase and Consumer Decision Journey)

– The traditional funnel is outdated.  However, much of the terminology has survived and/or been incorporated to the new, bright shiny (Mustard colored) circular tubes.   There is some consensus about the fact that the process is no longer linear but more of a circular conversation.

– However, the term “funnel” as well as “top” and “bottom” of funnel and stages such as awareness, consideration, acquisition were used frequently, particularly by CMOs.  However… the funnel must include advocacy.  (Social, social, social)  And, the funnel is iterative and, well, free flow.

7. Search:

– Google, Google, Google.

– Retargeting.  Performance display.  Auctions.

8. Big, big, bigger

– Most speakers came from or service large advertisers.  Not a lot of insight into how to get started with social, etc. if you’re small.

9. Digital Dollars

– Dollars are shifting into digital – because that’s where the audience is.  But… the livingroom, big screen experience is not going away, particularly with smart/connected TVs

– We’re hearing numbers like 20%, 40%, majority of dollars being spent on non-traditional/digital media including mobile, etc.  (See L’Oreal stats at end of post)

– Media and content providers finding that more of their content is being consumed wirelessly than wired (MLB)

– Yet… prices up 10% during TV upfront despite ratings declines

10. Bright Shiny Objects

– There needs to be a drinking game at these conferences where everyone drinks when they hear this phrase

– Oh, and also a drinking game about references to “Mad Men.”

11. Targeting (and Networks)

– Retargeting, cookie-ing, digital ad trading, real time bidding (RTB).  (These terms and tools seem to have supplanted behavioral advertising; I don’t recall hearing that term mentioned at all)

– Serving ads that are relevant to the consumer

– Dynamic ad insertion – available online – that means the ads are dynamically inserted when the user requests the page so it’s really, really targeted

– The Yahoo!, aol, Microsoft “three-way” designed to give Google a run for its ad network money

– “Data is changing our marketing lives.” – MicroStrategy executive

12. Youth, Hispanics and Moms

– Youth: Do we know how to connect with this savvy group?

– Hispanics: 50 million, according to current census, and many are not assimilating because they don’t have to, e.g., language.  Large families, heavy media users, especially mobile.  Univision is a top 5 network.  Can’t afford to ignore them.

– Moms: How to reach them?  They are not all the same…

——

9. Digital Dollars at L’Oreal:

“After doubling U.S. digital spending in 2010, L’Oreal will spend as much on digital here this year as over the prior two years combined, Mr. Speichert said. That will bring digital to around 10% of L’Oreal’s overall advertising outlay in the U.S., he said. Although he declined to detail spending levels in dollar terms, Mr. Speichert said L’Oreal’s measured spending here was $1 billion last year, up about 25% from the prior year.  L’Oreal is increasing its overall outlay rather than raiding other budgets to fund digital growth, he added.”